Sector-150 Noida tops India’s realty charts amid price and rental boom
For a wider perspective, ANAROCK analysed trends in capital appreciation and rental growth across 14 of the most active micro markets in Bengaluru, Hyderabad, Pune, NCR, MMR, Kolkata, and Chennai.

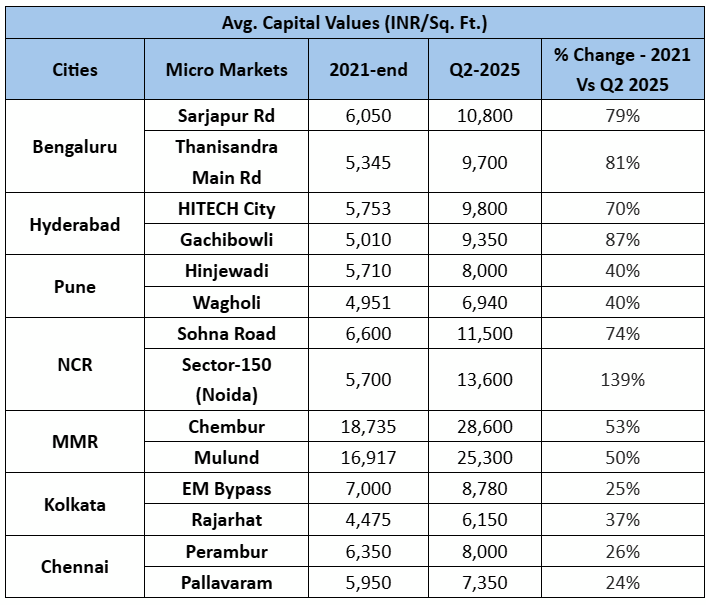
Sector-150 in Noida is the standout nationally. Its property values have soared 139% in just over three and half years.
India’s most vibrant housing micro markets have delivered exceptional returns between the end of 2021 and mid-2025 for both homeowners and investors, according to the latest ANAROCK Research findings.
In some pockets, property prices have almost doubled, while in others, rental growth has far outpaced inflation. This sharp upswing is fueled by two key factors — robust, employment-led demand and sustained infrastructure development — creating markets where both capital appreciation and rental gains are shaped by location advantages, connectivity, and strong economic momentum.
For a wider perspective, ANAROCK analysed trends in capital appreciation and rental growth across 14 of the most active micro markets (by supply and sales) in Bengaluru, Hyderabad, Pune, NCR, Mumbai Metropolitan Region (MMR), Kolkata, and Chennai, and explored the factors driving their performance.
National Post-Pandemic Snapshot
Anuj Puri, Chairman – ANAROCK Group, says,“The recovery that began in 2021 was driven by pent-up demand, record-low interest rates, and a structural shift toward homeownership after the pandemic. In the early recovery years, annual rental increases of 12–24% were common in prime employment hubs. By H1 2025, rental growth had moderated nationally to 7–9% — still ahead of consumer inflation, but a lot more sustainable.”
“Capital values followed a similar trajectory of rapid appreciation between 2021-2023, followed by steadier gains as new supply hit the market and buyers became more price sensitive,” says Puri. “Notably, infrastructure-led markets (those benefiting from new metro lines, expressways, or new planned tech hubs) continued to defy this cooling trend.”
Bengaluru: Sarjapur Road and Thanisandra
In India’s tech capital, two pockets have outperformed even the city’s robust average growth.
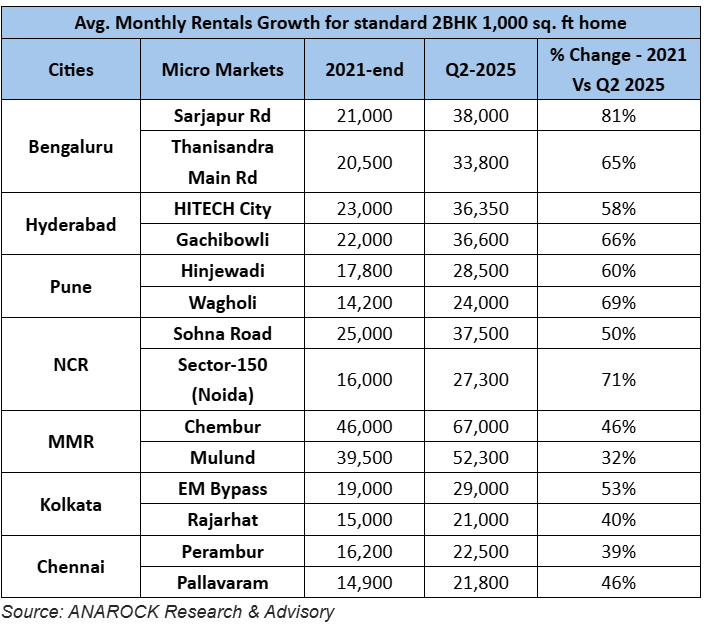
- Sarjapur Road has long been part of Bengaluru’s eastern IT corridor, but the promise of the Red Line Namma Metro—connecting Hebbal to Sarjapur—has fuelled a fresh wave of interest. Between 2021 and Q2 2025, property prices here jumped 79%, while average 2BHK rents climbed 81% to ₹38,000 a month.
- Thanisandra Main Road, in the north, has mirrored this trajectory with capital gains of 81% and rents up 65%. Its proximity to Manyata Tech Park and improving road connectivity have made it a magnet for mid-to-upper-income IT professionals.
Both areas also benefit from constrained land availability, which has kept the market tight, and speculative buzz around projects like the proposed ‘Swift City’ mega-tech hub in Sarjapur.
Hyderabad: HITECH City and Gachibowli
Hyderabad’s western corridor has cemented its place as one of India’s most resilient real estate sub-markets.
- HITECH City, the city’s tech heart, recorded a 70% rise in property values and a 58% jump in rents over the past three and a half years.
- Gachibowli, just next door, surged even more—capital values up 87%, rents up 66%. Its appeal lies in a concentration of multinational campuses, international schools, and premium residential complexes.
Even as national rental inflation has eased, these two pockets continue to post double-digit annual increases thanks to unrelenting demand from a growing IT workforce and the scarcity of ready-to-move-in apartments.
Pune: Hinjewadi and Wagholi
Pune’s performance underscores a familiar pattern: a mature IT hub supported by a fast-growing affordable fringe.
- Hinjewadi, home to the city’s largest IT park, saw prices rise 40% and rents climb 60% since 2021. While rental growth has slowed since late 2024, demand remains stable thanks to a steady influx of young professionals.
- Wagholi, further out but well-connected to the city via the Nagar Road corridor, matched Hinjewadi’s capital gains but outperformed on rentals with a 69% increase. Its relatively lower buy-in cost has made it a preferred choice for first-time investors seeking yield.
NCR: Sohna Road and Noida Sector-150
The National Capital Region’s story has two distinct threads – established corporate corridors and new-age investor magnets.
- Sohna Road in Gurugram blends both worlds: strong corporate leasing nearby and improving connectivity via the Delhi–Mumbai Expressway linkages. Prices are up 74% since 2021, while rents have climbed 50%.
- Sector-150 in Noida is the standout nationally. Its property values have soared 139% in just over three and half years – the fastest among all micro markets in this study – fuelled by new township projects, greenfield planning, and investor enthusiasm. Rents here have also surged 71%, reflecting demand from both working professionals and end-users drawn by its planned open spaces and sports facilities.
Mumbai Metropolitan Region: Chembur and Mulund
In land-starved Mumbai, price growth in suburbs with improved transport access has been striking.
- Chembur, once a relatively under-the-radar suburb, has been transformed by the Eastern Freeway and Metro Line extensions. Prices are up 53%, and rents have grown 46%.
- Mulund, a gateway between Mumbai and Thane, has seen similar capital gains (50%) but slower rental growth (32%), partly due to higher starting rental levels. Large-format apartments and better suburban amenities have attracted families upgrading from more crowded city neighbourhoods.
Kolkata: EM Bypass and Rajarhat
Kolkata’s growth story has been steadier – but still rewarding for long-term investors.
- EM Bypass benefits from proximity to the central business district and major arterial roads, pushing capital values up 25% and rents up 53%.
- Rajarhat, a planned township to the east, has seen stronger capital appreciation at 37%, driven by new infrastructure and corporate presence, alongside 40% rental growth.
While not as spectacular as NCR or Bengaluru, Kolkata’s trajectory underscores the value of planned growth and connectivity.
Chennai: Perambur and Pallavam
Chennai’s two highlighted markets—Perambur in the north and Pallavaram in the south—both owe their performance to excellent transit links.
- Perambur has seen prices rise 26% and rents 39% since 2021, supported by suburban rail and metro access.
- Pallavaram, near the airport and GST Road, posted a 24% price gain and 46% rent increase, appealing to both airline staff and IT professionals working in the nearby OMR corridor.
Why These Markets Outperformed
A few themes repeat across these leading micro markets:
- Infrastructure Investment – Metro lines, expressways, and airport expansions have proven to be the most reliable catalysts for both capital appreciation and rental demand.
- Employment Clusters – Markets anchored by IT hubs or corporate campuses – Sarjapur, HITECH City, Hinjewadi—show the strongest rental growth, a reflection of constant in-migration.
- Planned Urban Development – Locations like Sector-150 Noida and Rajarhat benefit from master planning, green spaces, and large-scale amenities, attracting both investors and end-users.
- Relative Affordability – In cities where core markets are priced out, peripheries like Wagholi, Thanisandra, and Mulund offer more approachable entry points, creating steady absorption.
Outlook 2026
“Looking ahead to 2026, we expect average housing price growth to range between around 6–7%, with rents likely to rise 7–10% – both outpacing inflation,” says Anuj Puri. “Micro markets tied to major infrastructure completions (such as metro lines in Bengaluru and Mumbai, expressways in NCR, and IT park expansions in Hyderabad and Pune) are best placed to sustain above-average gains.”
In India’s real estate market, growth follows infrastructure, and rental resilience follows jobs. For investors, identifying the next wave of connectivity and employment corridors could be the difference between average returns and exceptional ones.